
On my page, I discuss a working paper titled "Postal Growth: How the State-Sponsored Post Affected Growth in France, 1550-1800" (last updated September 3, 2021; The paper was long titled “Ethnic Autonomy,” APSA Preprint v3).
The Puzzle
How do states strengthen their capacity when the technologies of control are highly scarce or simply unavailable?
motivation
The technologies of control are tools that enable the state to make its subjects “legible” — to keep it short and borrow James Scott’s now classic Seeing Like a State (1998). Legibility refers to the state’s ability to render its subjects “identified, observed, recorded, counted, aggregated, and monitored” so that the state acquires deep knowledge about them (p. 183).
Examples include:
census
cadastral surveys
maps
direct income tax
citizenship; and
the passport.
Enforcement is buttressed by physical infrastructure, including overland transportation (roads, bridges, railways) and maritime transportation (boats on navigable rivers, ships). Combining tools with enforcement capacity, sociologist Micheal Mann coins the term infrastructural capacity to refer to the state’s ability to “penetrate its territories and logistically implement decisions” in his classic The Sources of Social Power (vol. 2, 1993).
Only in modern times do these become available and cover the entire territory. But how did pre-modern states construct legibility and strengthen infrastructural capacity under constraints?
state-run Postal service in early-modern europe
The postal system was operational at least since Roman times, but the speed was slow. Postmen on horseback could travel for 30-40 km a day at the time. By the mid-1400s, the average was 20-60 km a day, depending on the urgency of the news.
Germany (Kaiserliche Reichspost) made the system 6 times faster, by placing relay stations at much shorter intervals (2 to 3 miles). Specialized “postmasters” were hired and assigned to take care of lodging and horses.
England and France followed suit. Theoretically, the key point here is that they had little strategic planning as to where to place posts. They created posts primarily to meet the diplomatic and defense needs of the day. To reinforce this point, neither state spent much on the system, despite mounting running costs.
The demand for private use (called “uncommissioned” use in England) was high. This is so despite the fact that neither England nor France permitted it. Germany is distinct in that it made its system open to the public from the beginning and outsourced the operation to the Taxis family.
England and France eventually sanctioned private uses for a fee to contribute to the running cost and supplement income for postmasters.
The network expanded based on the one built in this haphazard manner.
Did the postal service bring about positive externalities or spillover effects as a public good?
data
I use early-modern France as an example and focus on the expansion of its postal service by drawing on hitherto undigitized published sources. Data is available for 1553, 1690, 1792.
I assess how postal expansion affected city-level growth from 1600-1850 as an outcome variable.
My time-series and cross-sectional data set comprises 214 cities * 5 fifty-year periods from 1550-1800 = 1,070 observations.
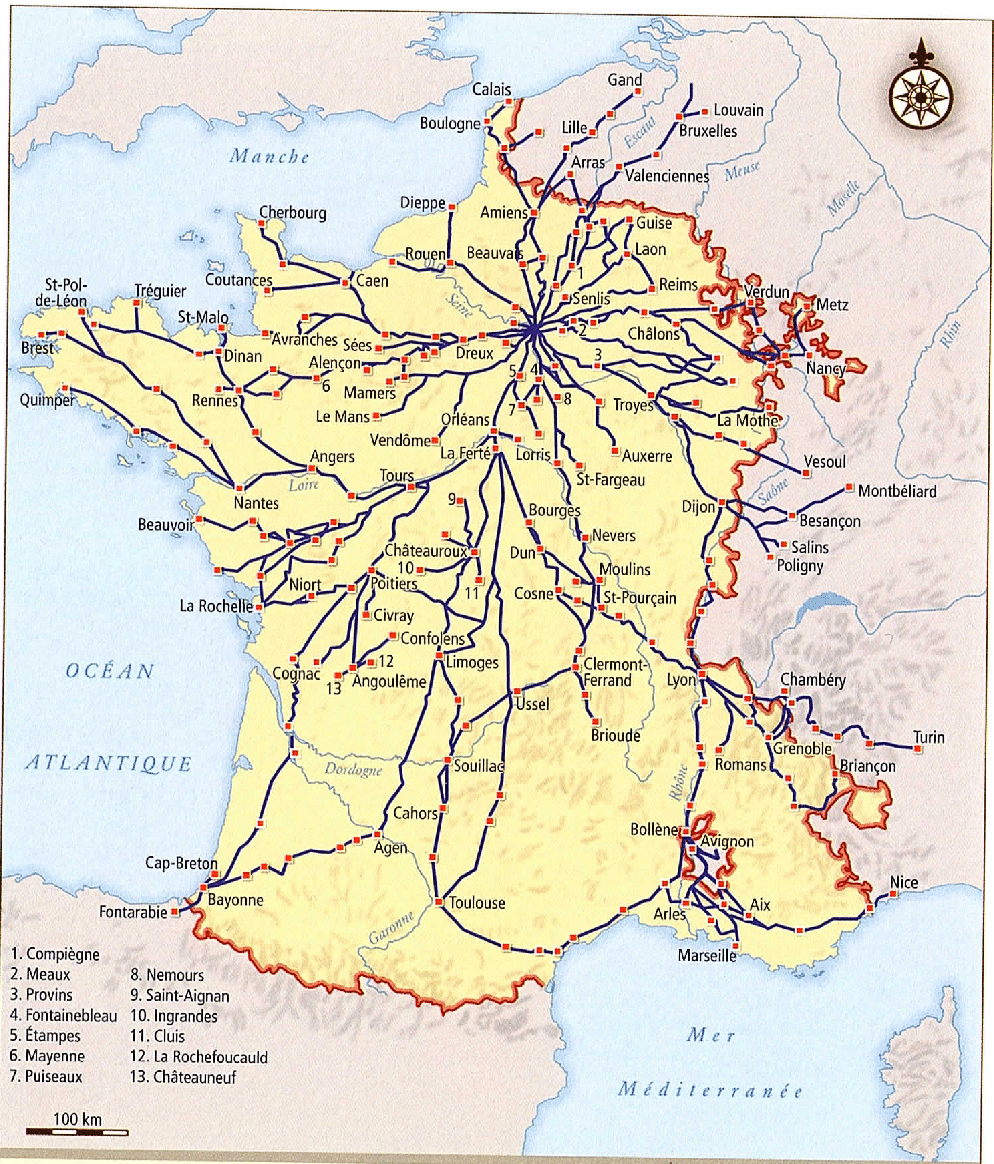
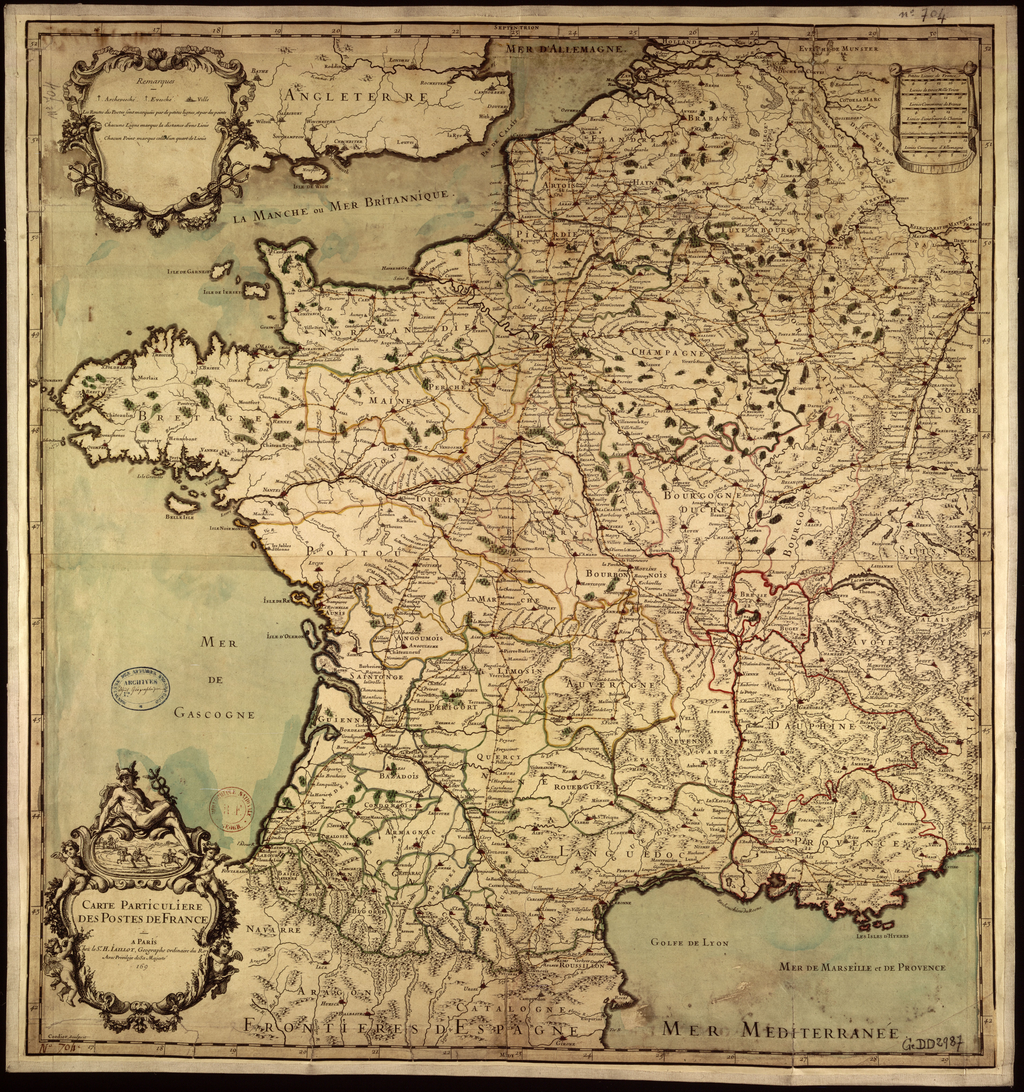
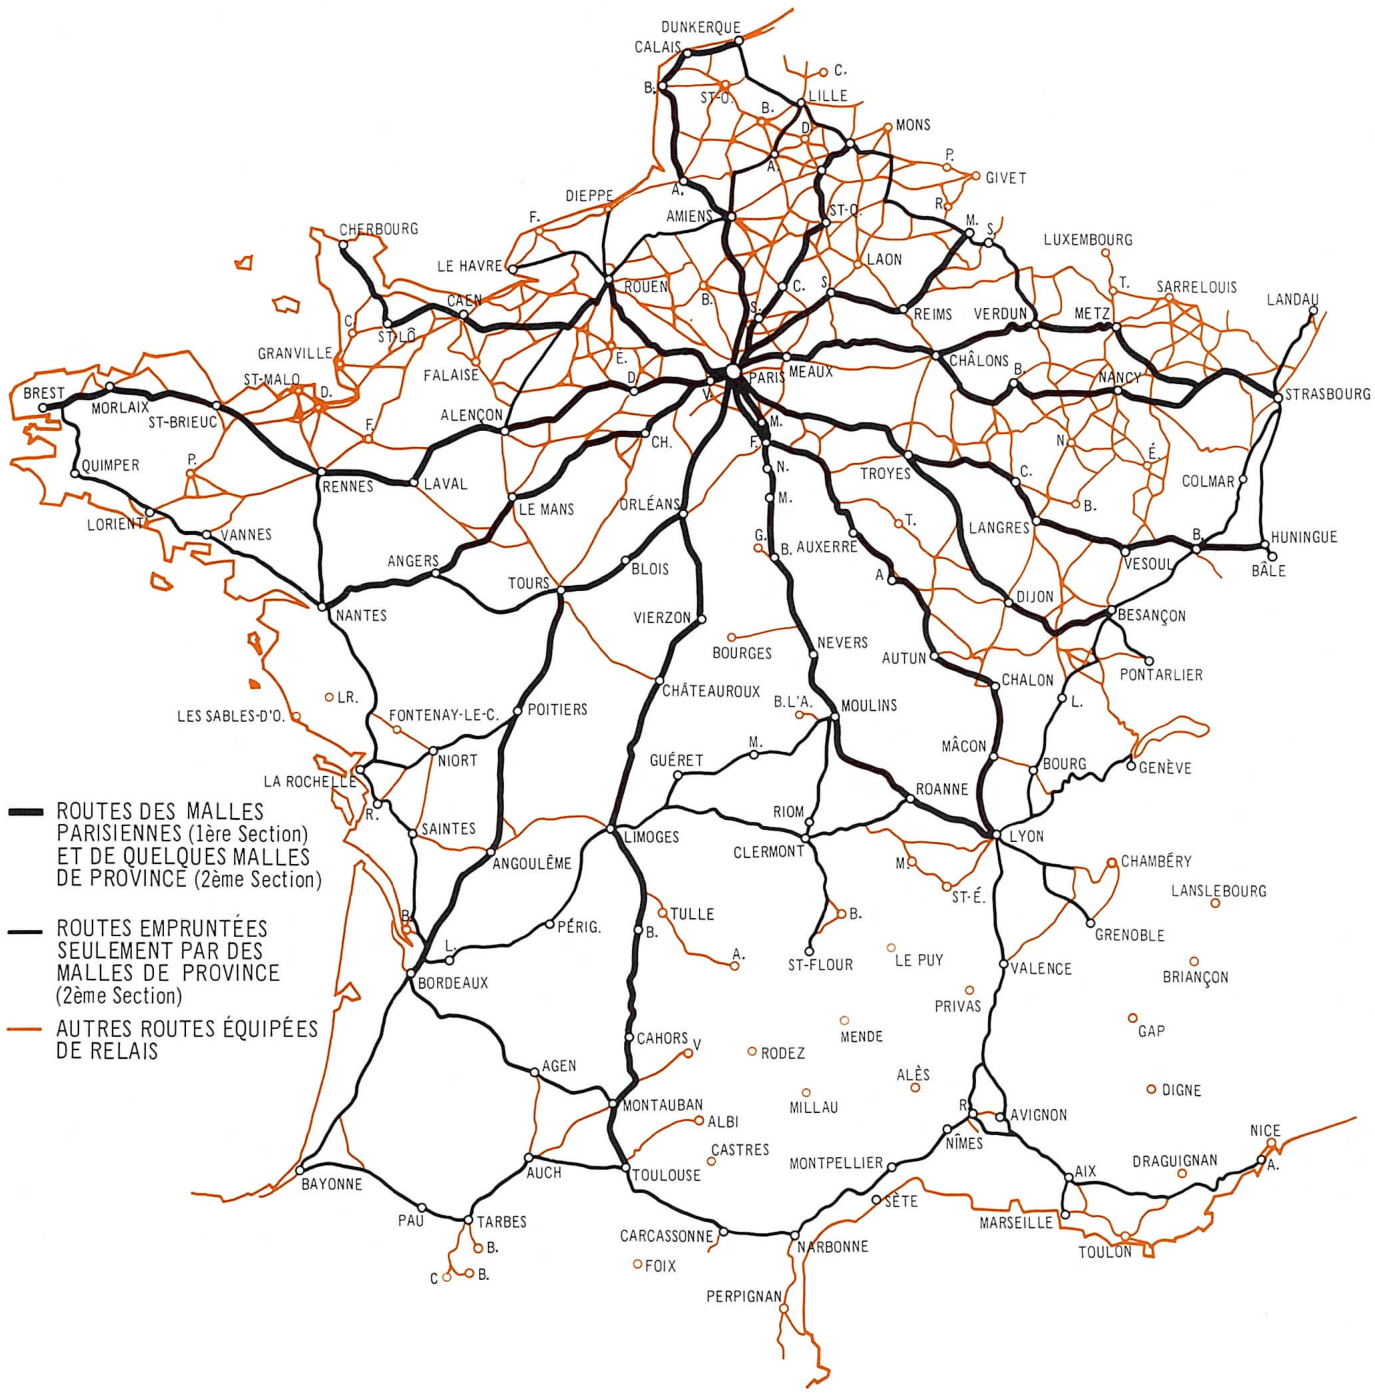
Below I present descriptive statistics on postal expansion, 1553-1792 (click to enlarge).
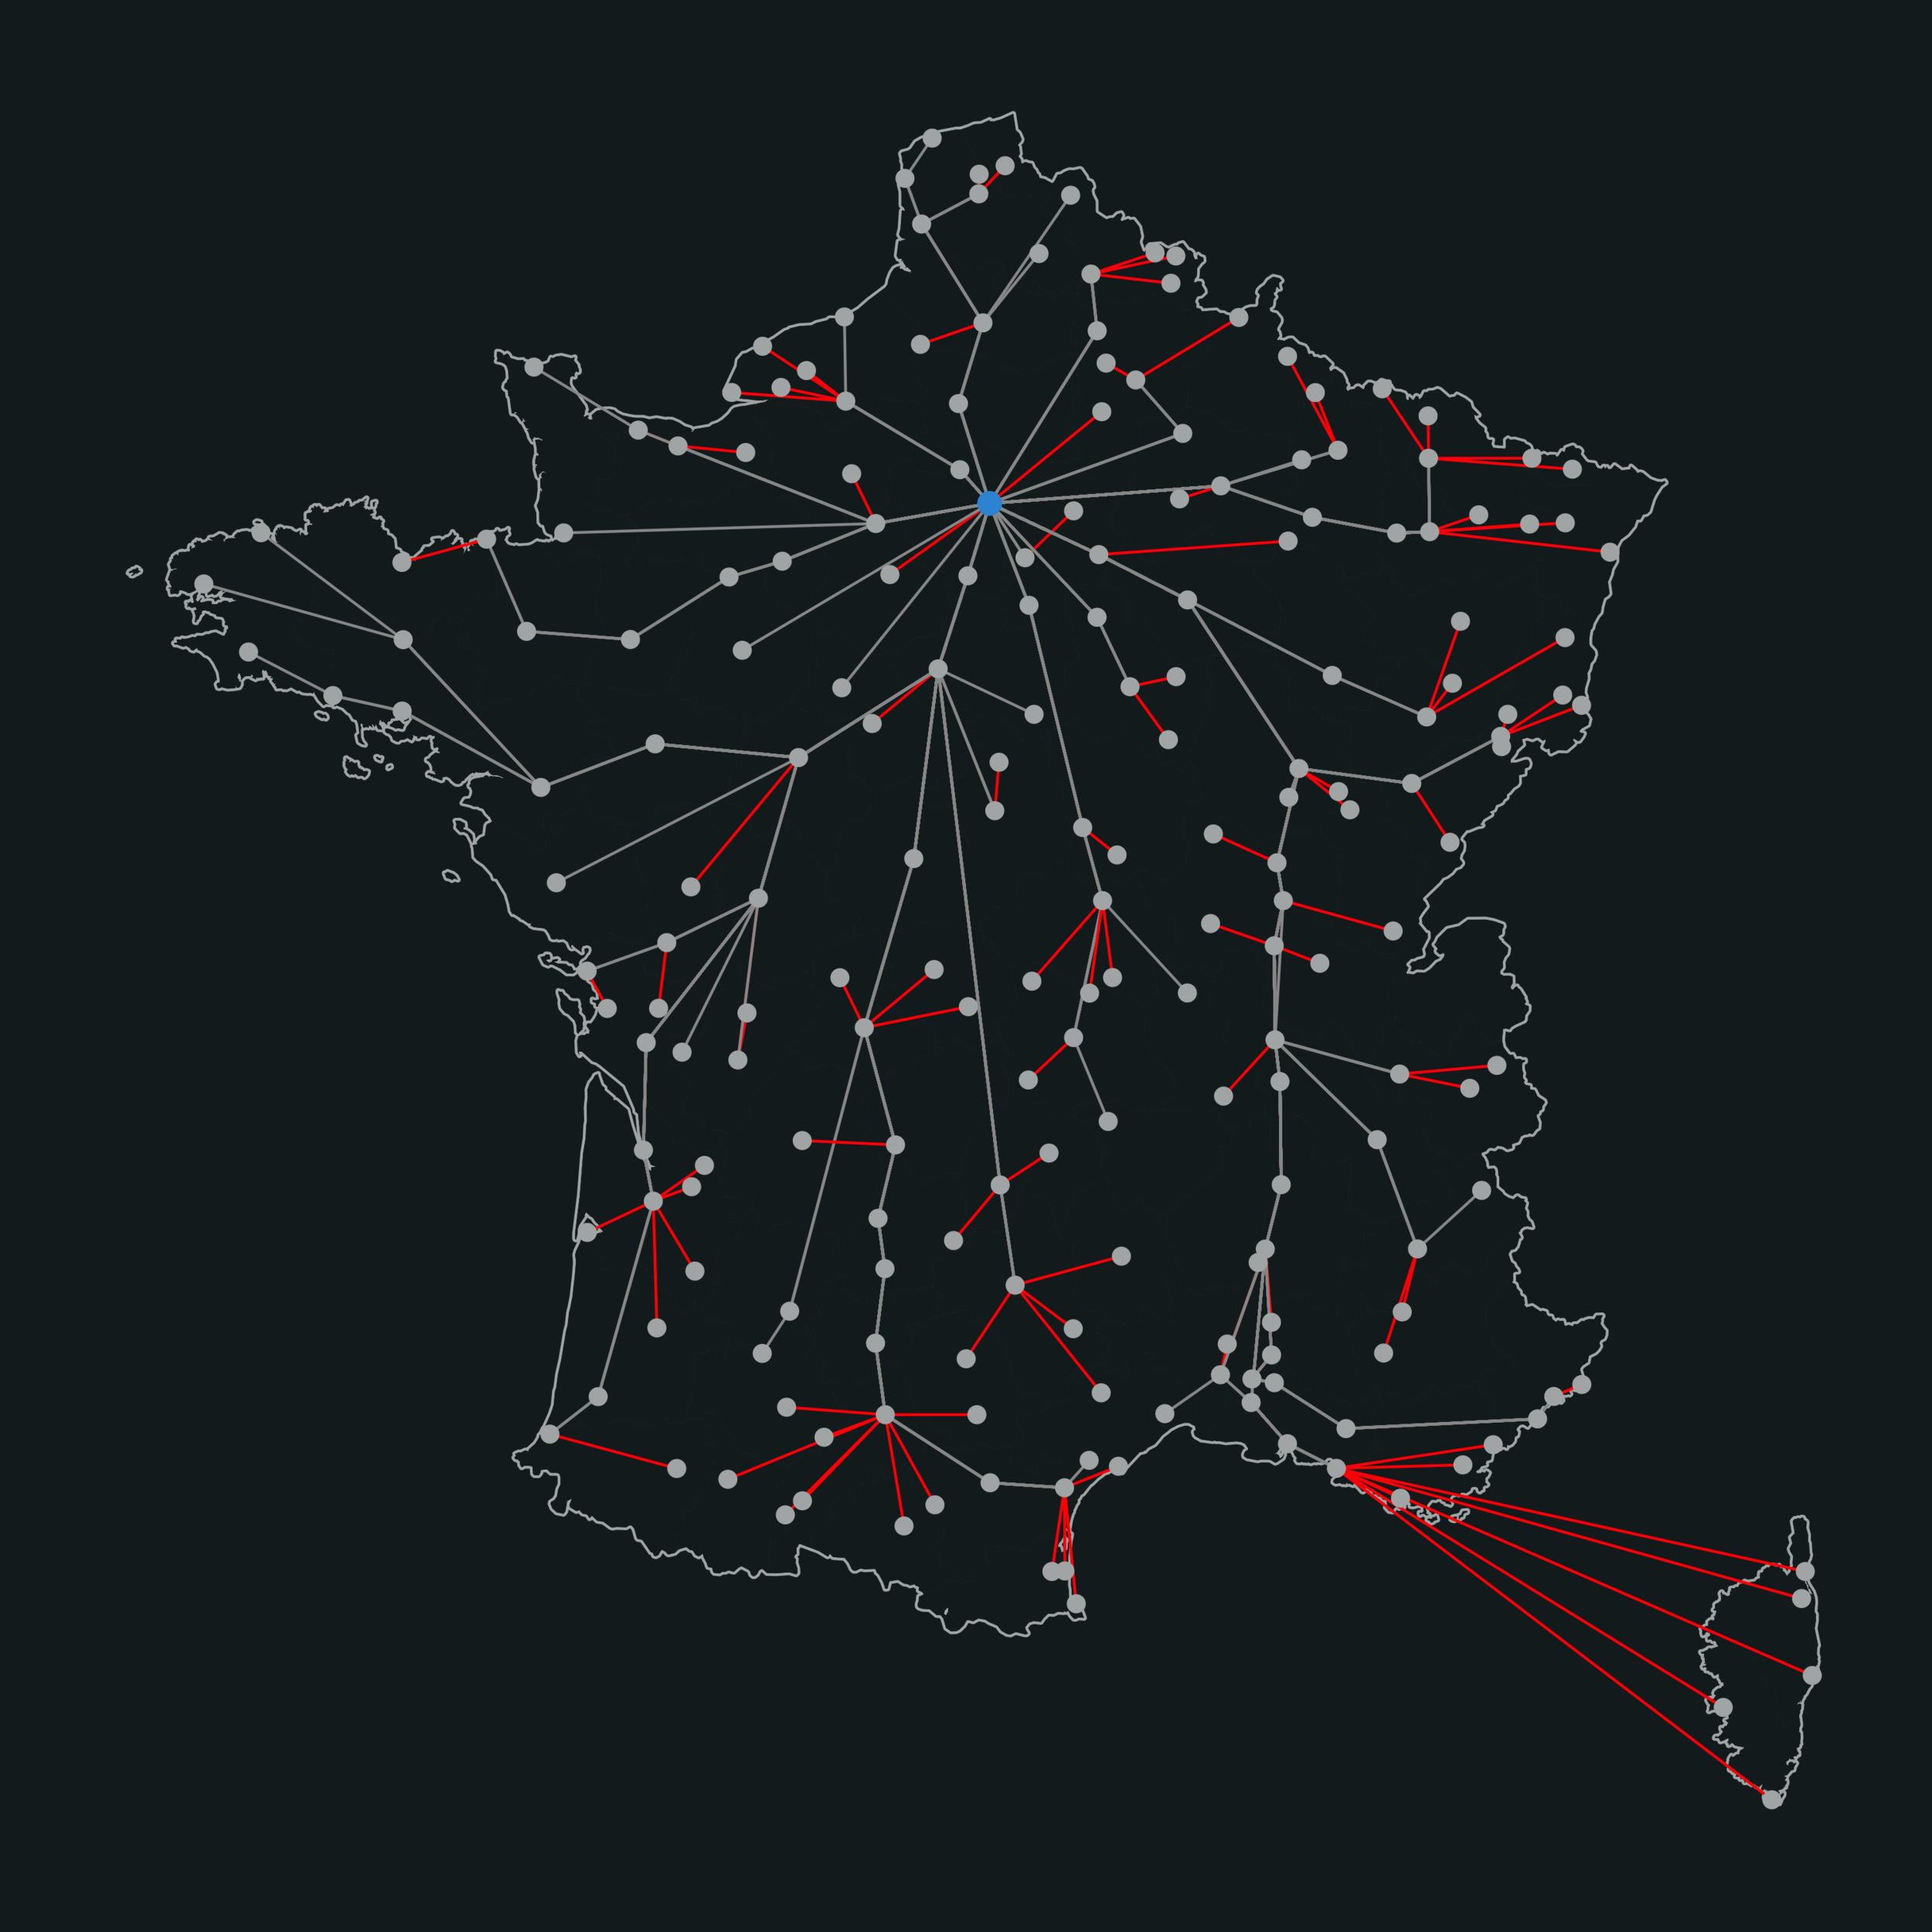
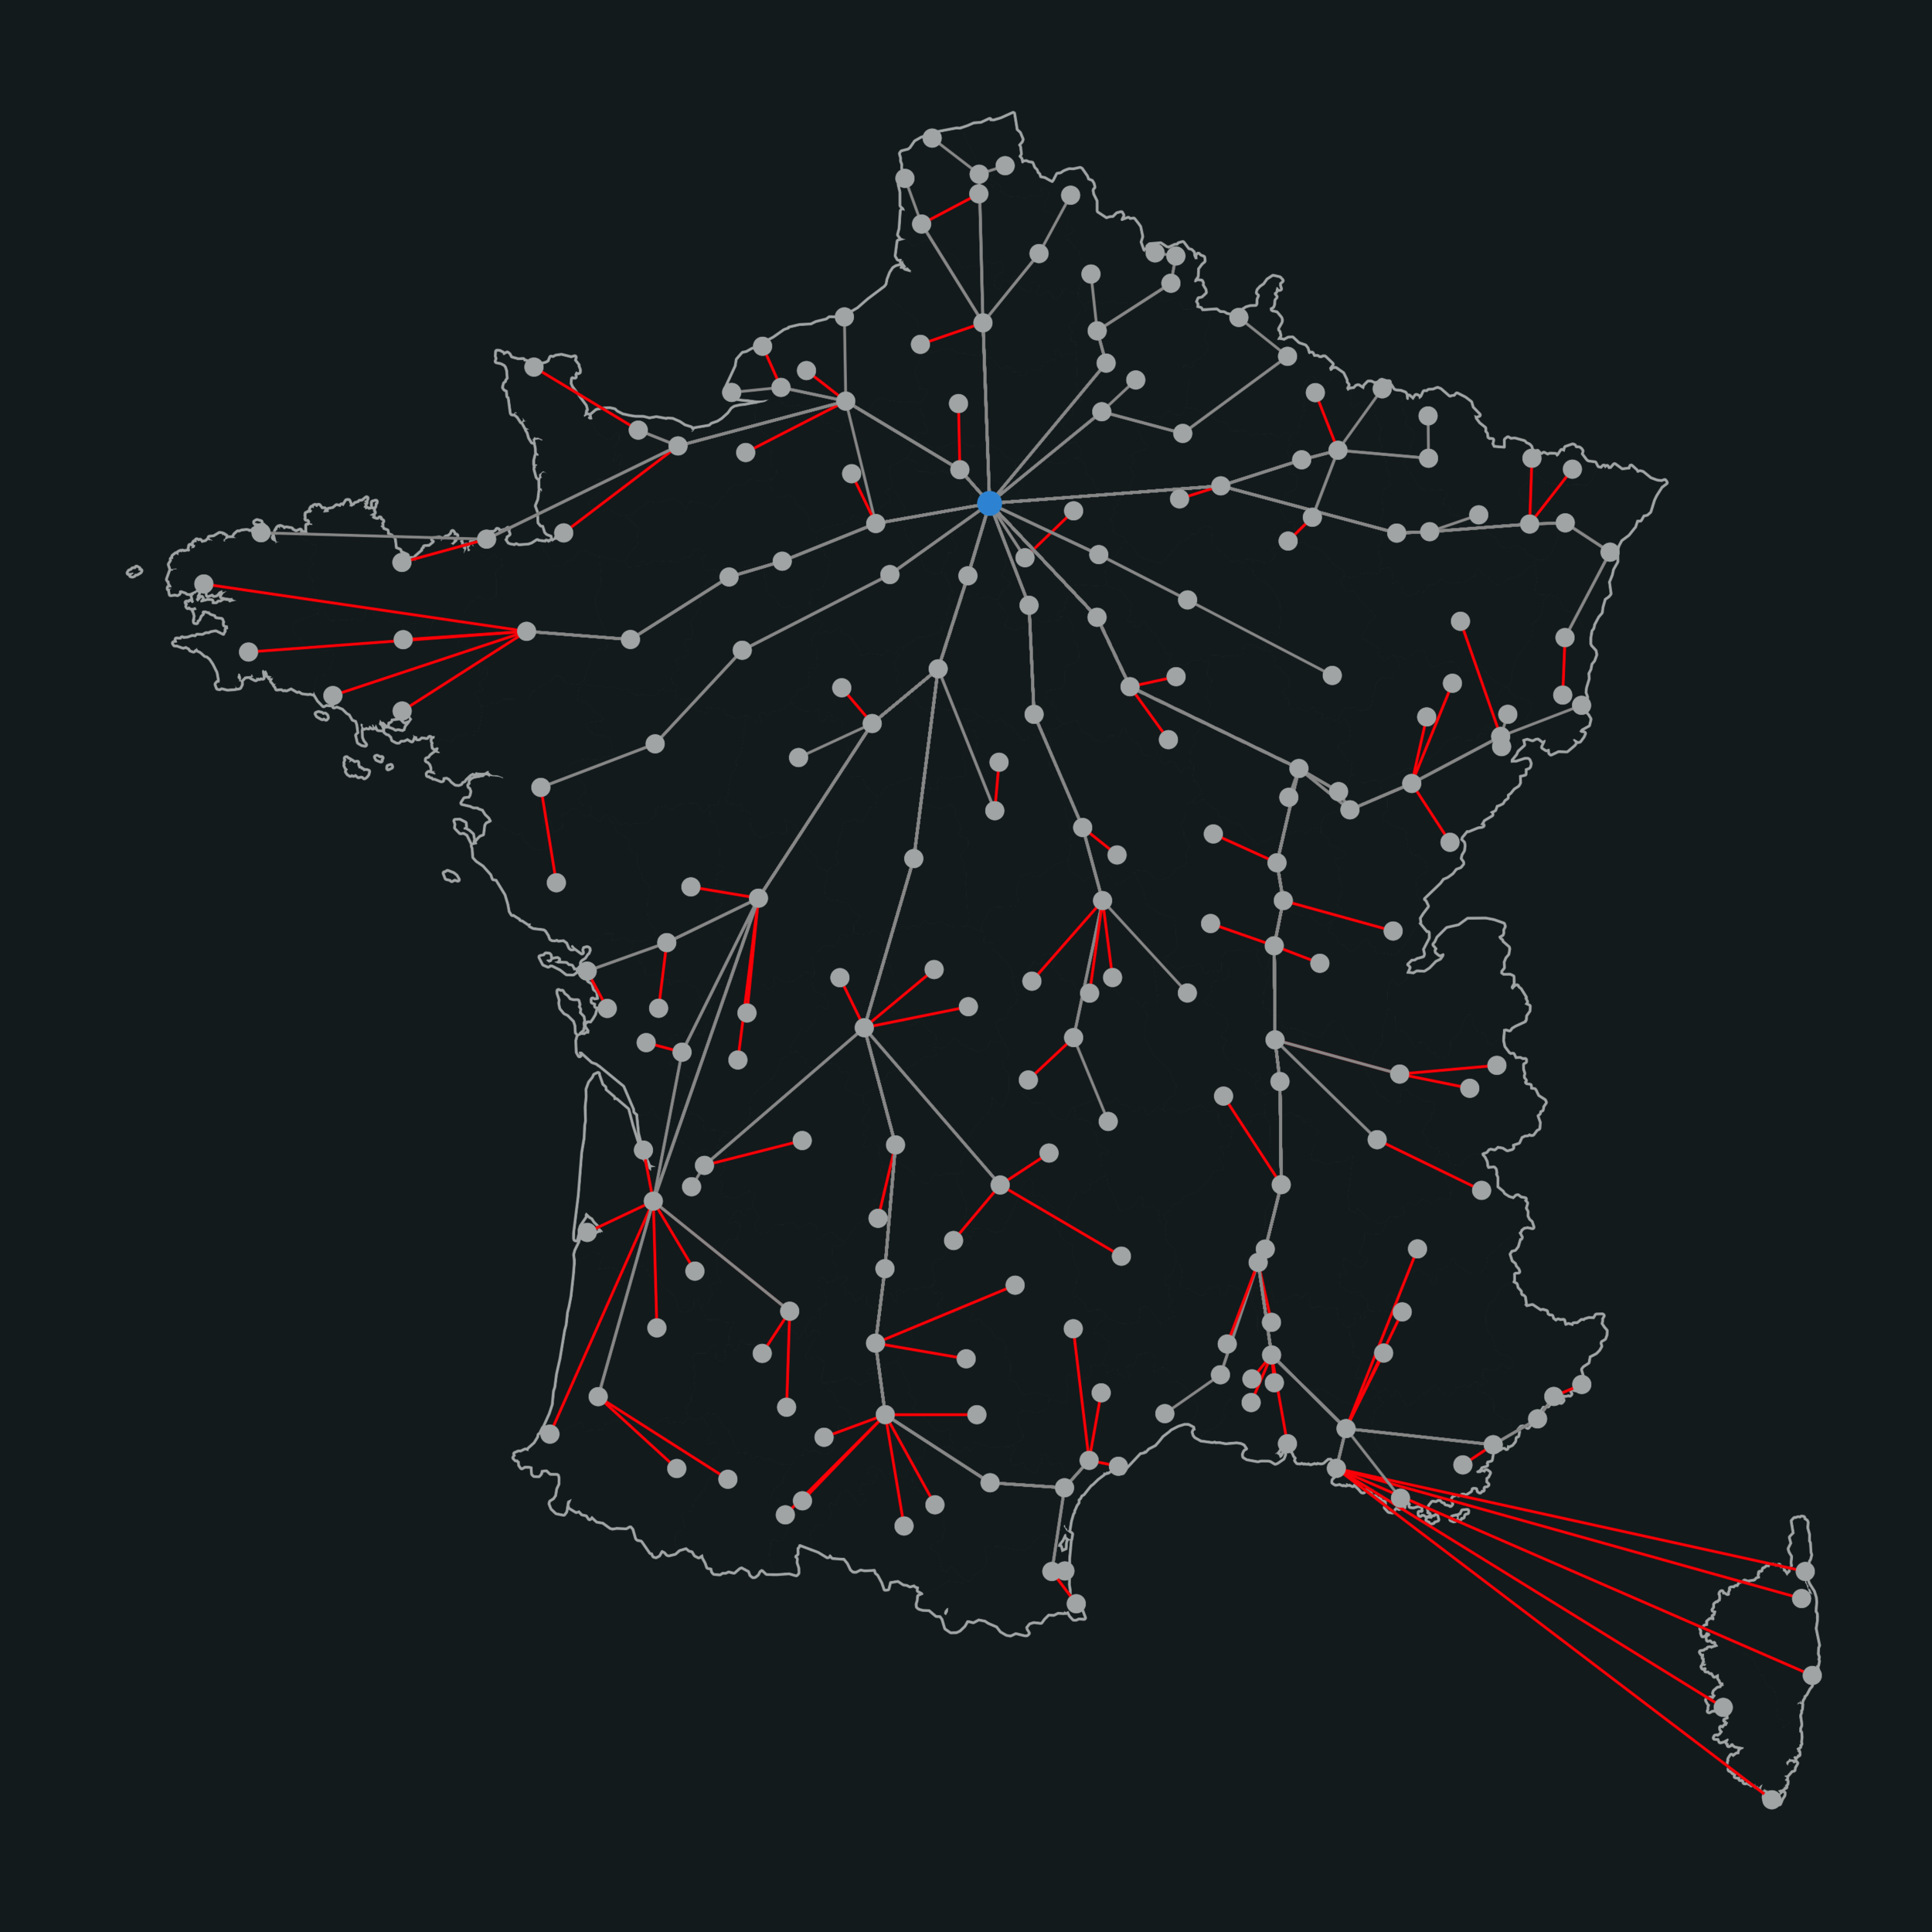
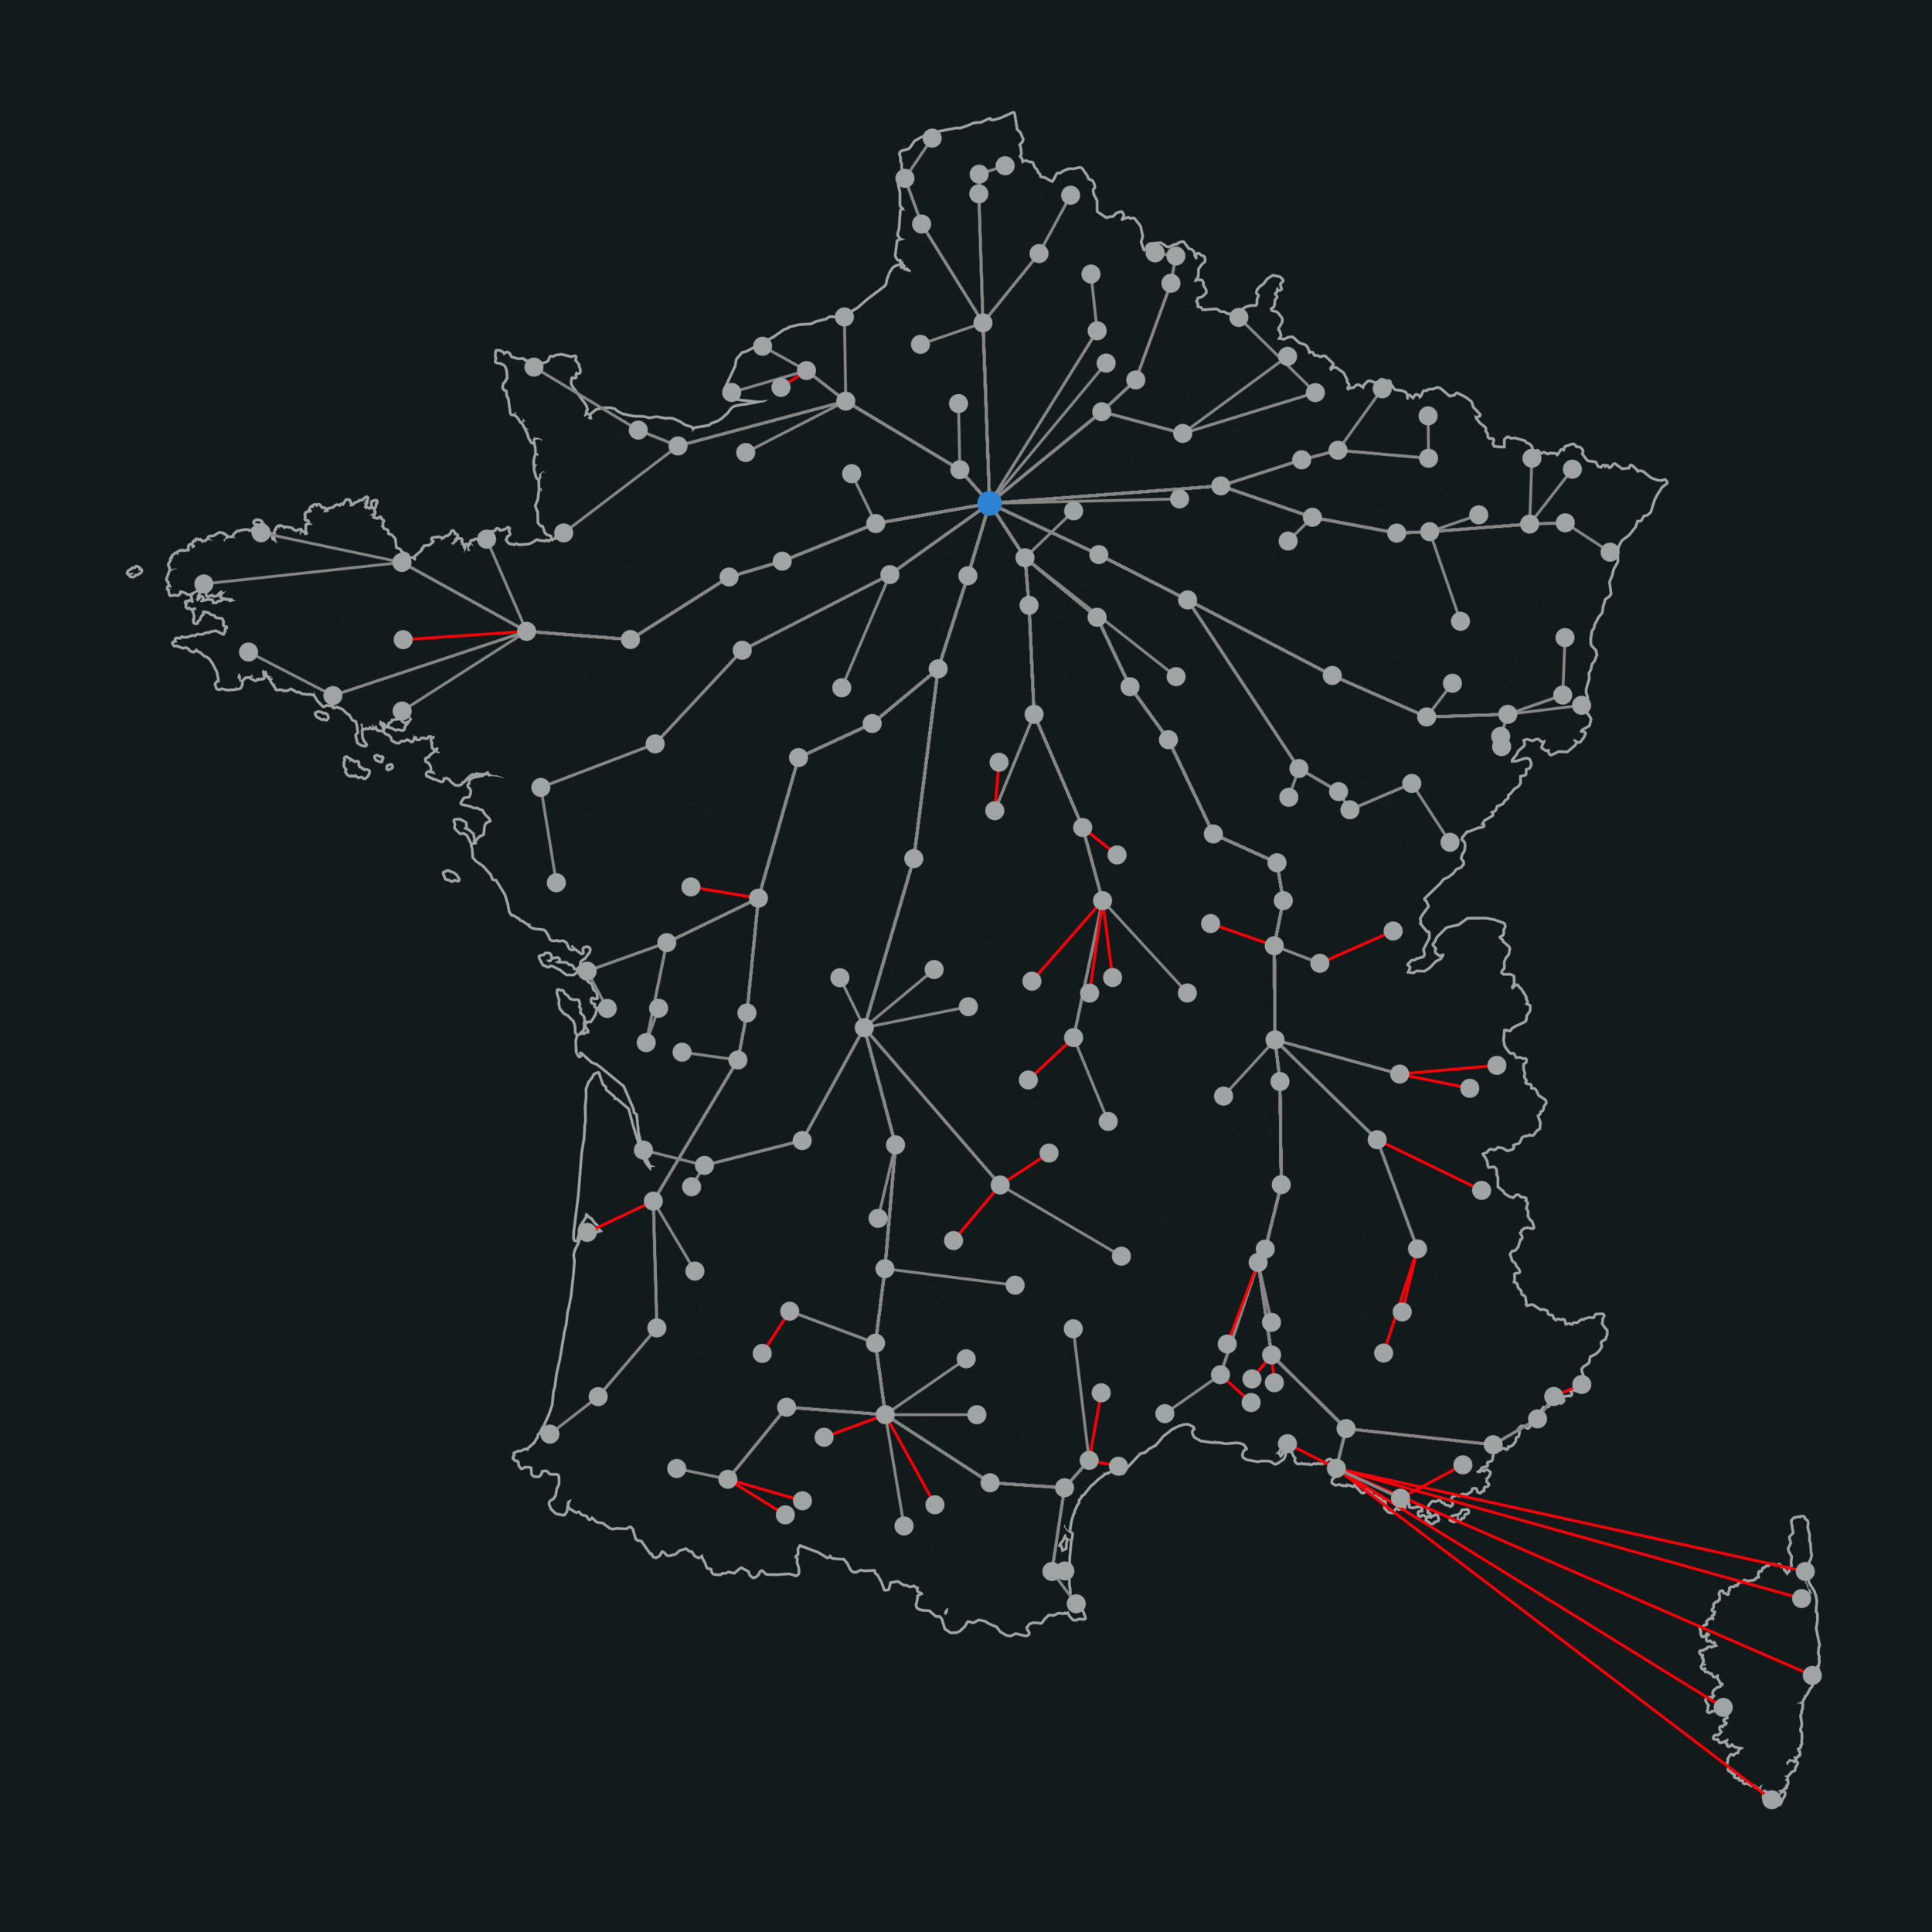
The dots represent the location of cities, the gray lines postal routes, and the red lines an access to the nearest on-route city for the off-route towns. For comparison, the original map for each period is displayed.
Data: Travel cost (Main explanatory variable)
One of my contributions is to construct a travel-cost variable as my main explanatory variable. It is computed as a ratio of post-guided distance to great-circle distance (The below figure visualizes the variable construction). For each observation, I take a pair between Paris (the origin) and a given city (the destination). I follow the postal route in a given pair to calculate the distance — this is the numerator (the P’s in the figure). I also calculate the “nominal” (i.e., great-circle) distance of the pair as the denominator (the D’s). The division yields the travel cost. When the destination is outside the postal network (City_3), I find the nearest post-bearing city based on the original map for each period (in this case City_1 for City_3).
For City_2, the travel cost from Paris is (P_1 + P_2)/D_2.
For City_3, the travel cost from Paris is (P_1 + P_3)/D_3. Since City_3 is outside the network, I can quantify various costs of P_3 as an extra burden for Paris to reach the city.
Travel-cost variable construction. P’s represent postal routes. P_3 (red) is the access to the nearest post-bearing city for City_3. D’s represent great-circle distances. Travel cost calculation is P/D.
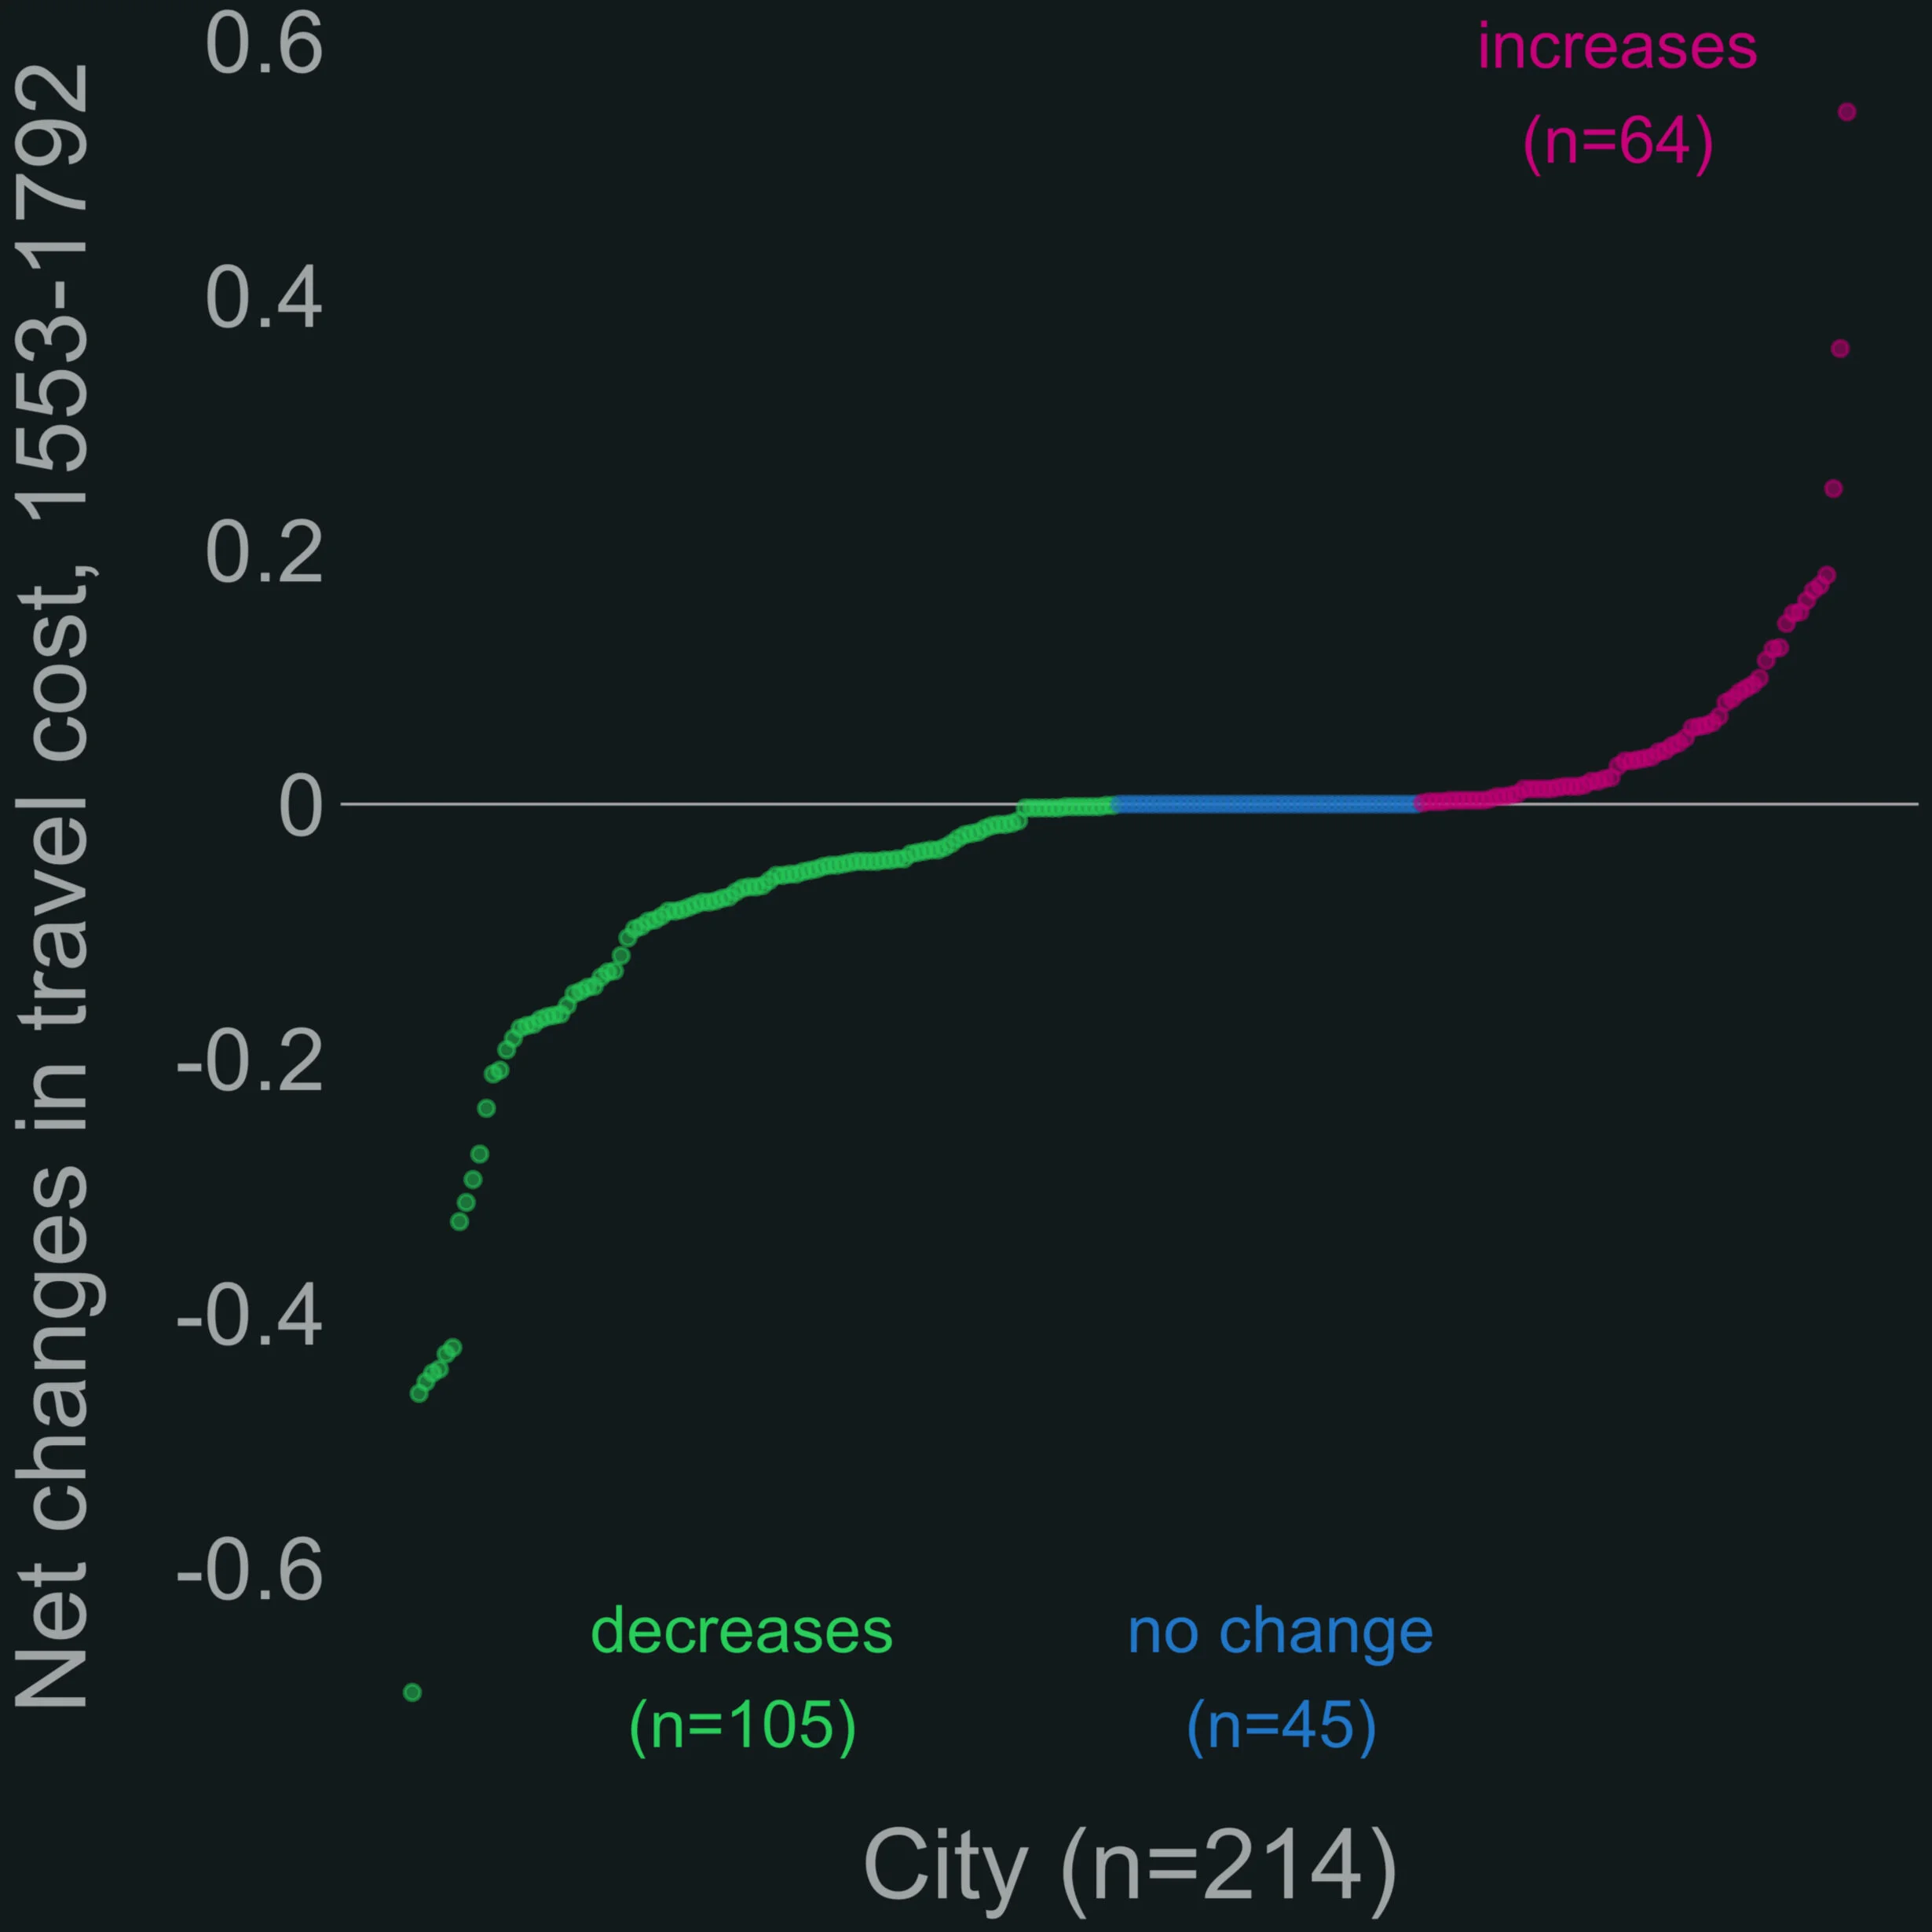
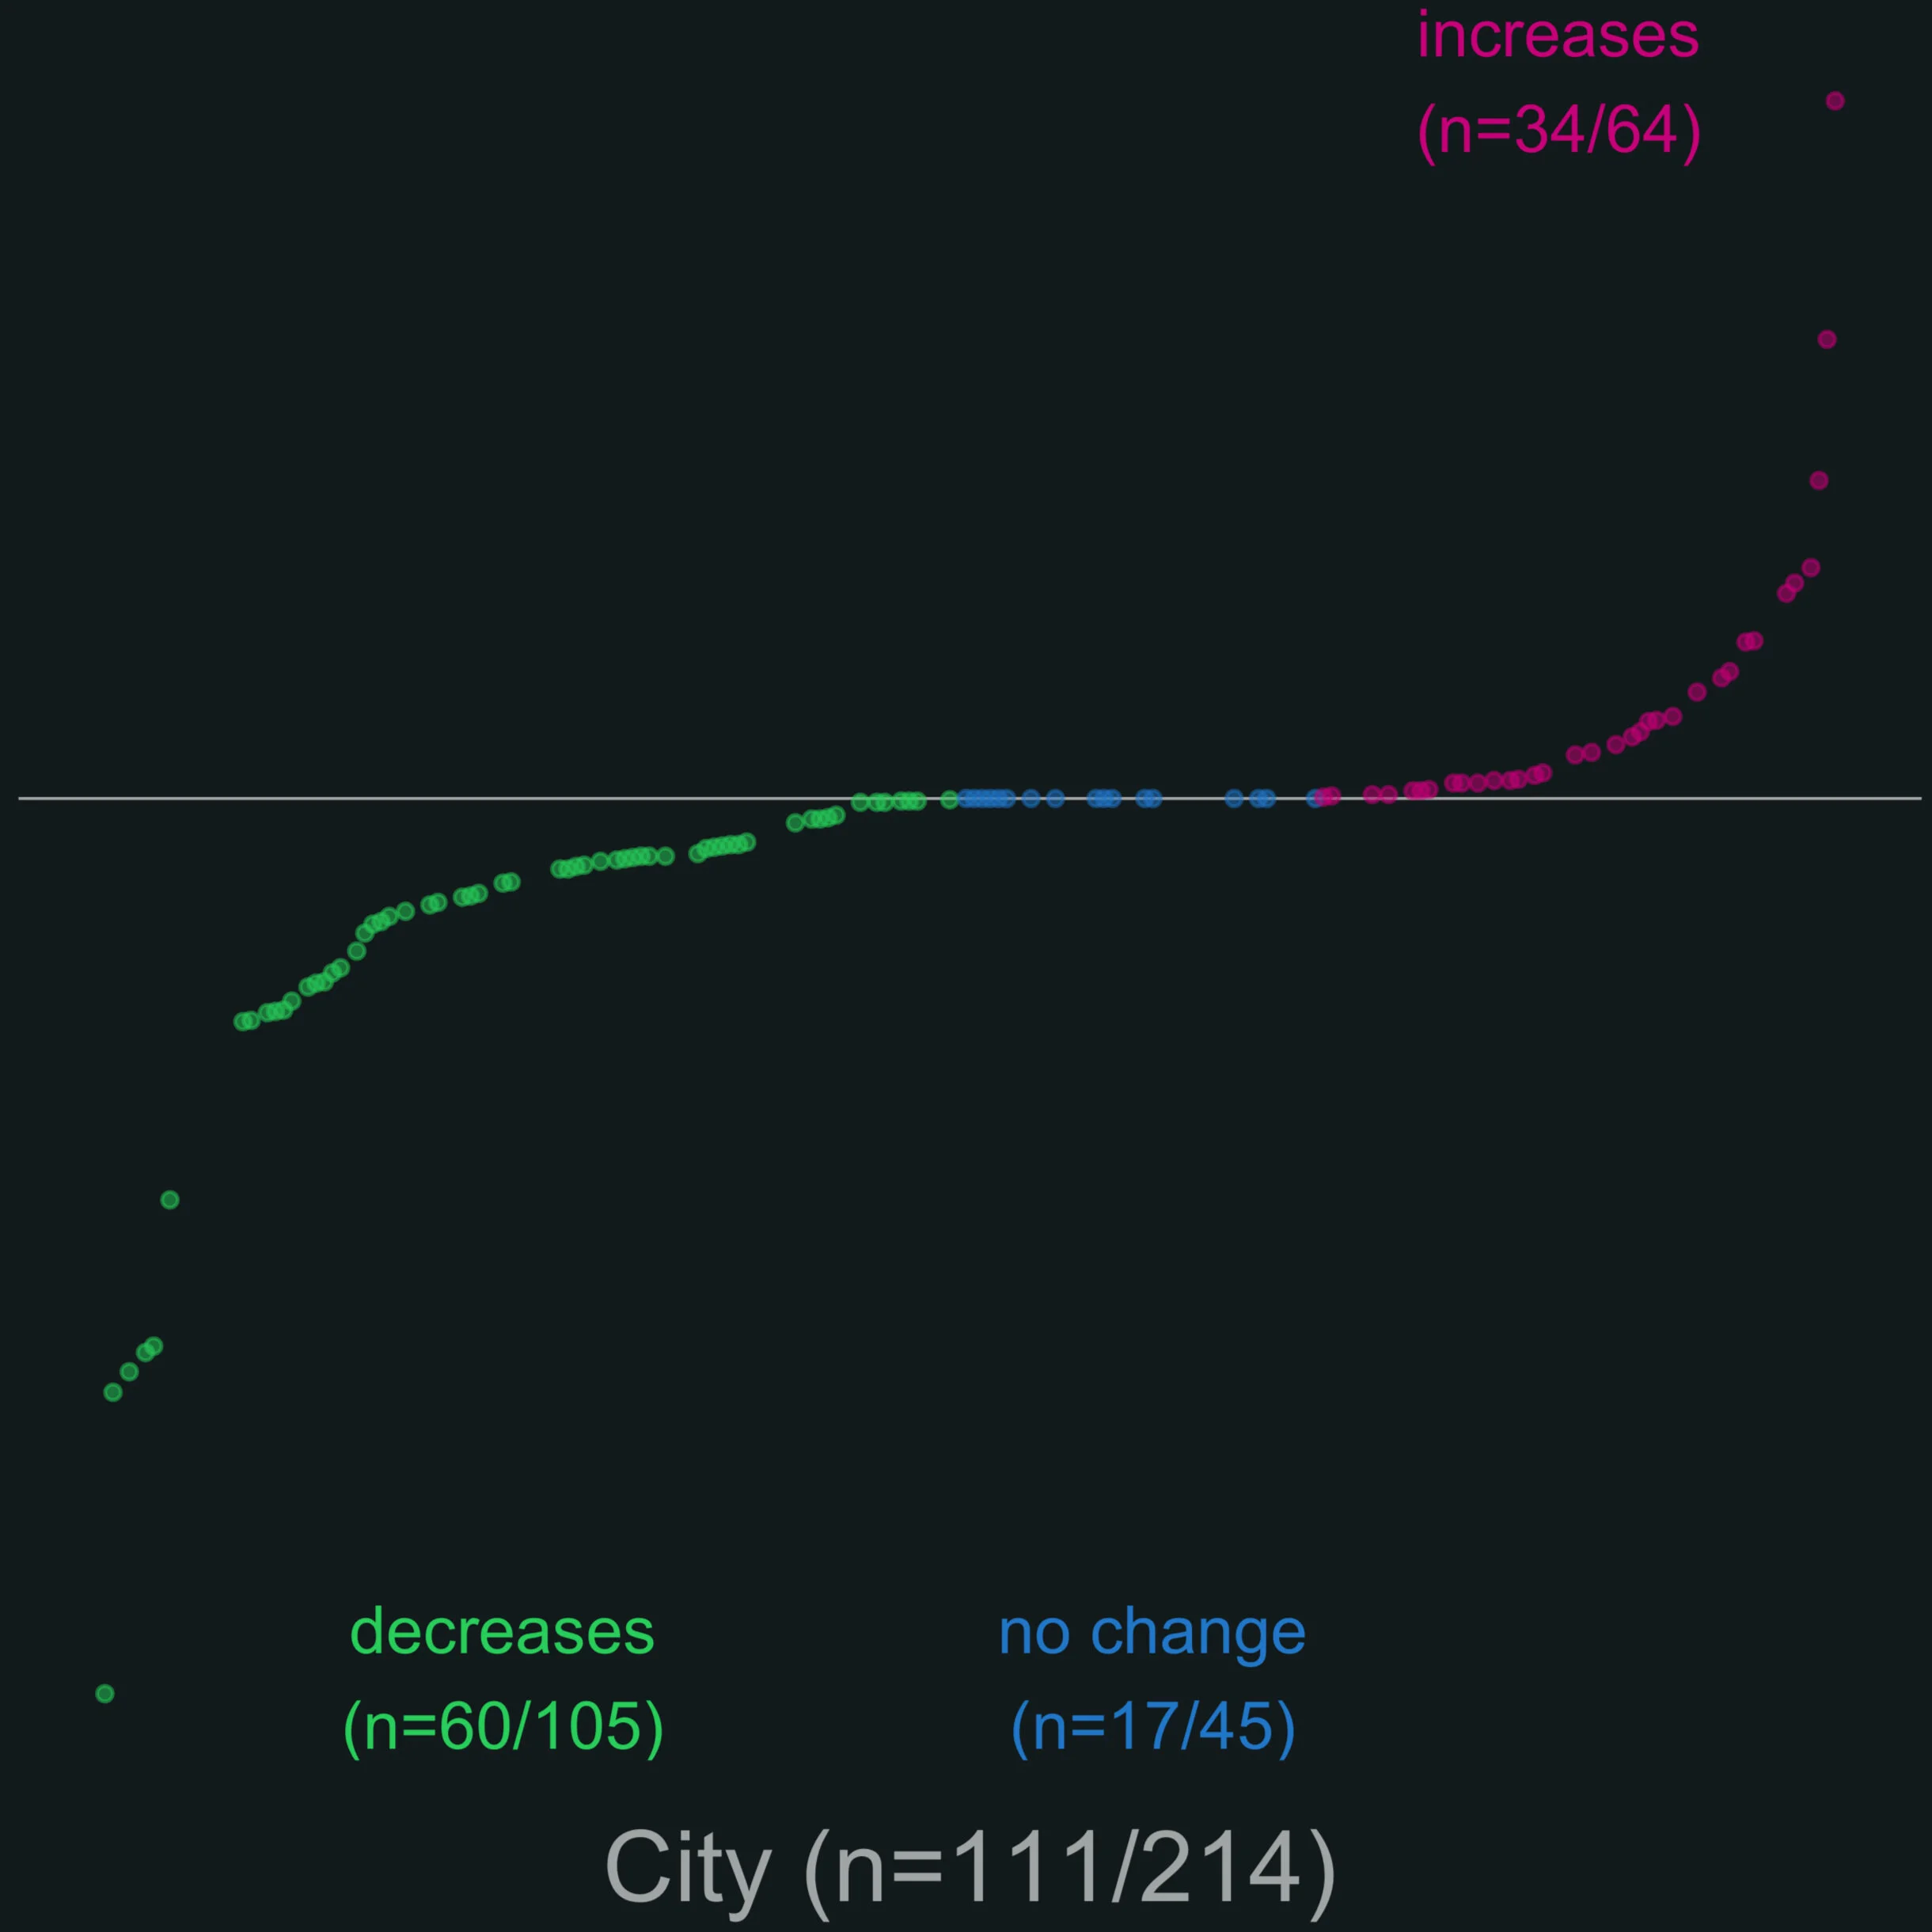
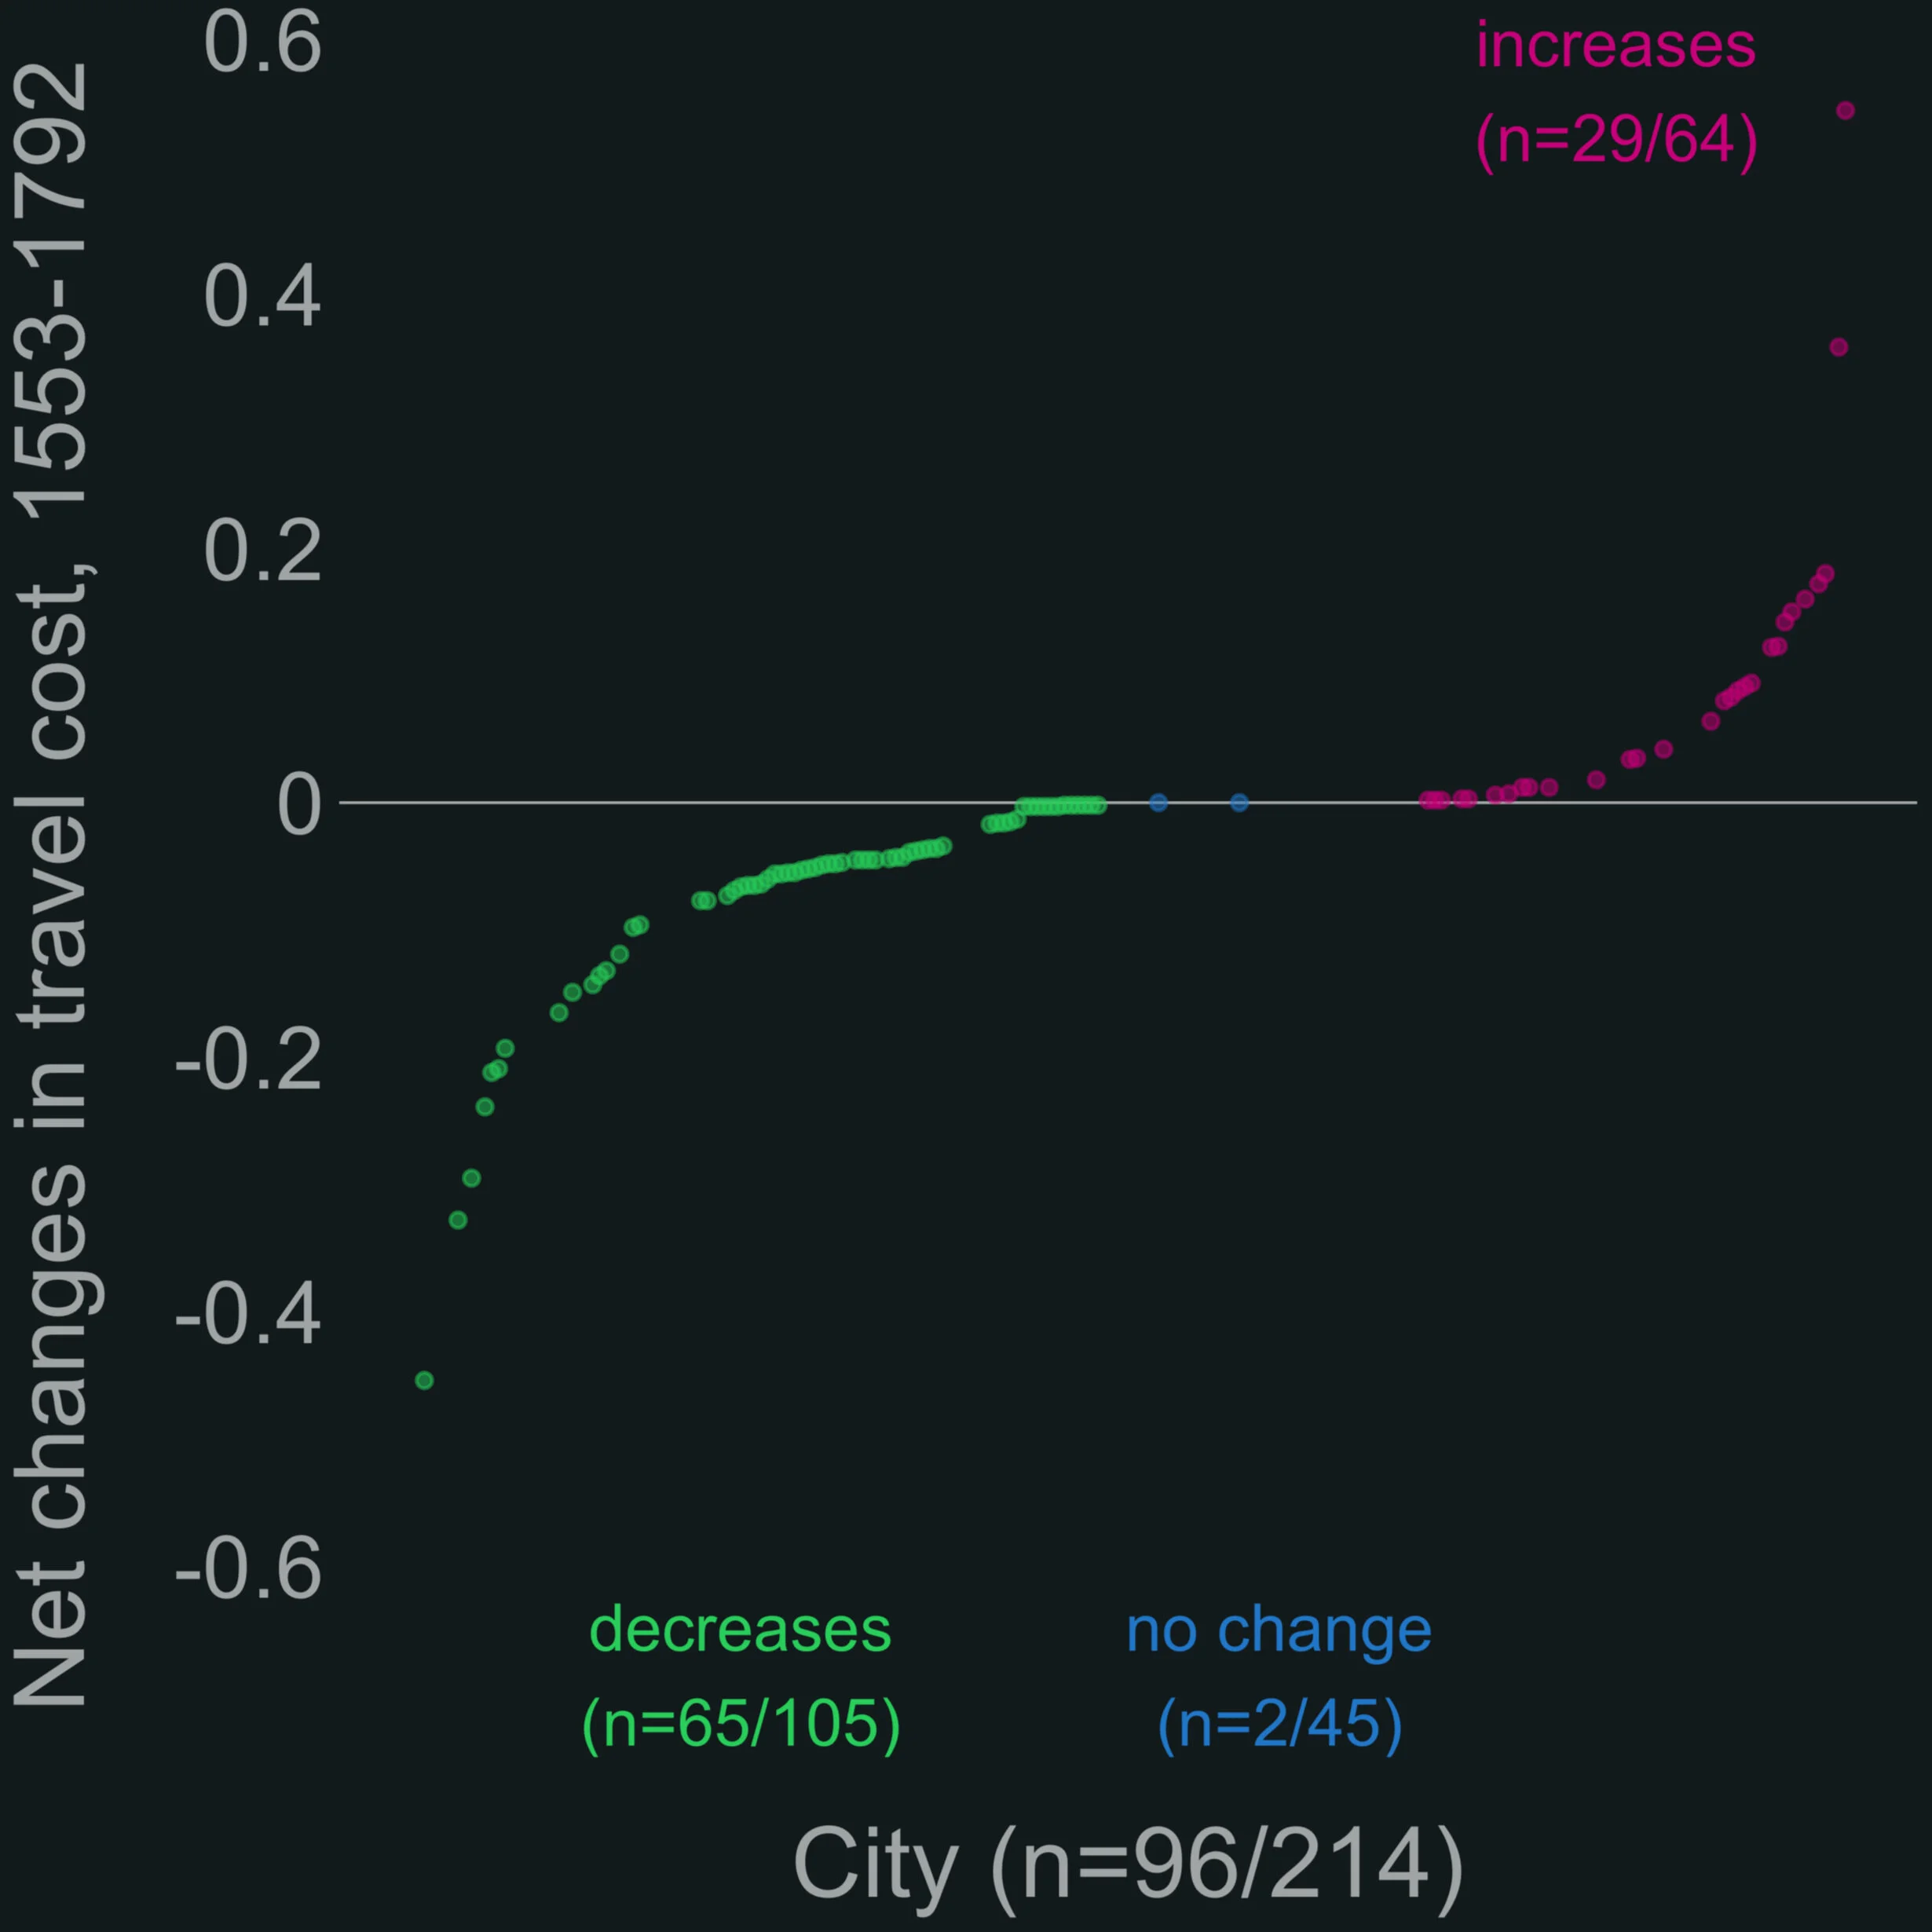
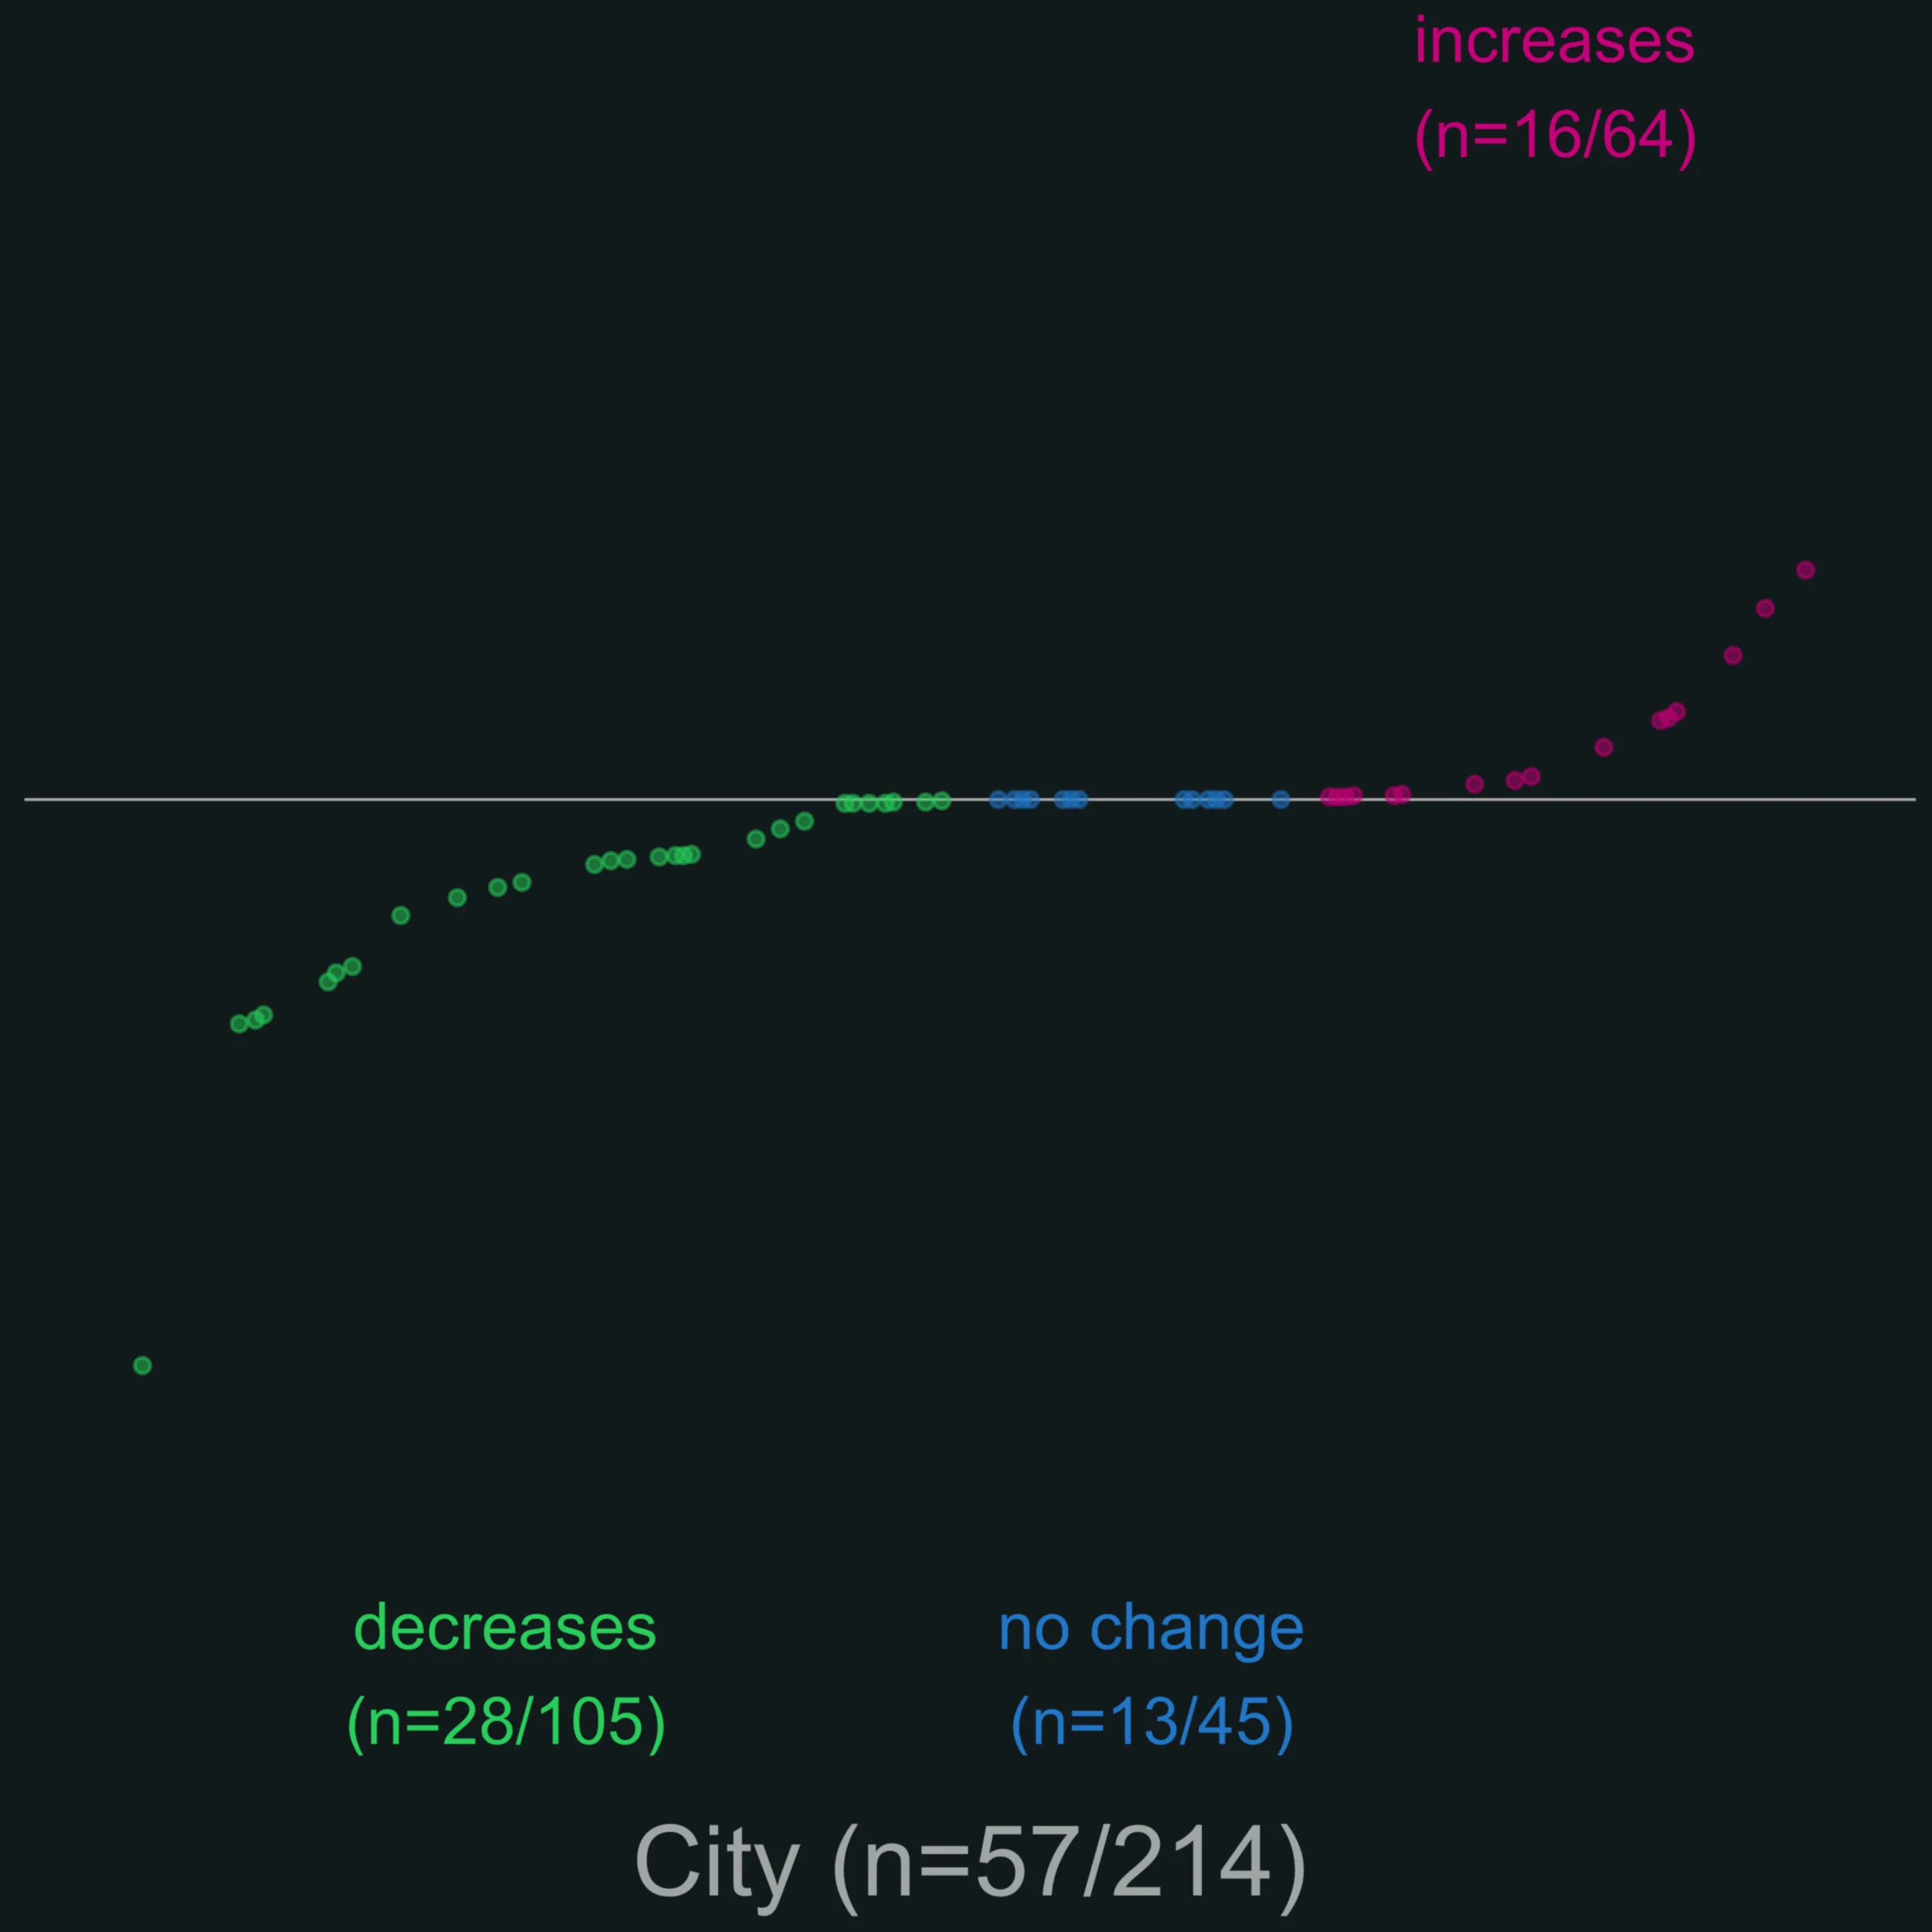
The below figures display the cumulative changes of travel costs for each city. They are calculated by summing the change in travel costs from one set of periods (1553 to 1690) to the next (1690 to 1792). Three colors each correspond to three distinct outcomes: Green = net decreases, Blue = no change, and Pink = net increases. The left panel shows all observations. The cities that experience changes in travel cost over time comprise 169 (nearly 78%) of the 214 observations. The average change amounts to -0.033. The right panel explores one source of this variation — that a given city was outside the postal network in 1553. Predictably, a majority of the net changes comes from the off-route cities in the beginning.
The data set contains these variables:
Unit: 214 cities * 5 periods (50-year intervals from 1550-1800) = 1,070 city-half centuries
Outcome variable
population size, 1600-1850 (lagged one period)
Main explanatory variable
travel cost from Paris, computed as a ratio of post-guided distance to great-circle distance
network of post offices available for 1553, 1690, 1792
Geographical variables
land elevation above sea level
terrain ruggedness
distance to nearest coast
distance to nearest border
Economic variables
number of cities holding commercial fairs within 50 km
number of canals within 50 km
Cultural variables
number of universities (observed at the département level)
access to printing press
Other controls
effect of the Protestant Reformation (closer distance to either Wittenberg or Zürich)
Roman legacy (Roman roads, hub Roman roads)
access to navigable river under Roman rule
Results
I indicate above that early-modern European states had a mix of political and economic motives to decide on where to place the post. The below figures provide descriptive evidence as to which cities are likely to experience greater net changes in travel costs. Green = net decreases, Blue = no change, and Pink = net increases. The left panel includes 96 cities whose distance from Paris is above average (about 372 km), while the right panel includes 57 cities whose population size is above average (about 5,610 people) in 1500. A regression analysis using the post office in 1553 as an outcome corroborates that these cities are likely to be included in the initial network.
Given these drivers, I document evidence from panel regression that reductions in travel cost are positively associated with city growth. More substantively, a one-standard-deviation decline in travel cost in 1553 yields a 3.14% increase in population size by 1850.
When extra costs for the off-route cities are considered, the magnitude of travel-cost reductions on population size becomes larger — up to twice the cost added to these cities. For more see Table 6 in the paper.
Results: within-country analysis
In this section, I explore:
Whether/the extent to which postal service had positive externalities or spillover effects for the cities outside the network; and
Whether/the extent to which cities that happen to be on located along major roads enjoyed disproportionate advantage by virtue of location.
For analysis, I did respectively:
select the 20 cities that comprised the top 10 percent population in 1550 and identify the “suburb” — 59 towns that have direct access to those 20 populous cities, either by a postal route or as the nearest post-bearing city.
select 13 pairs of major cities and identify 40 cities located along the “straight lines” of these pairs.
The below figure visualizes Part 1. I choose this set of suburban towns as they are most likely to be main beneficiaries of the postal service. If the system has positive externalities, they should benefit from them the most by virtue of proximity.
59 suburban towns with direct access to the 20 cities that make top 10% population size in 1550 (named on the map).
For empirical analysis, I create an indicator variable equal to one if a city matches the criterion, zero otherwise. I use it to interact it with the travel cost variable. The result is that the interaction term is negatively but not significantly linked. It suggests that spillover effects are not strong.
The below figure visualizes Part 2.
13 pairs of major cities on the postal routes (named on the map) and 40 cities lying along these pairs of “straight paths.”
Similar to Part 1, I construct an indicator variable equal to one if a city is on the “straight” paths and interact it with the travel-cost variable. The result is negative and significant, suggesting that their location accords these cities disproportionate advantage in terms of enhanced economic activity over time.
Overall, the within-country analysis suggests that Paris may have picked up economic “winners” without much spillover effects to off-route towns until the modern period.
Implications
My analysis finds that while cities included in the initial postal network by Paris reaped benefit, off-route cities enjoyed little spillover effect.
This economic disparity seems to beget ethnic cleavages. My paper’s evidence corroborates the pre-industrial French society depicted in Eugen Weber’s magnum opus, Peasants into Frenchmen (1976). He describes how the countryside was left impoverished and linguistically unintegrated — that is, non-French-speaking and even hostile to interacting with French officials descending from Paris — until well into the Third Republic that began in 1870. In the book, Weber offers a vignette in which a family in a rural village were delighted to see a postman deliver them a letter as mail delivery was a rare event. Only in the late nineteenth century when the railway was introduced and more roads were built did these state-run projects have an intended effect as public goods by integrating the countryside.